
Quick answer: What goes into a claim chart? A claim chart breaks one patent claim into individual limitations, then maps each limitation to specific evidence from an accused product, a prior art reference, or an industry standard. A well-prepared chart also includes a header block, pinpoint citations, claim construction notes, short explanations, and a clear statement of assumptions.

A claim chart can win a licensing negotiation before anyone files a complaint. It can also sink a lawsuit in the first month if the mapping is thin. Patent teams know this, yet they keep asking the same practical question: what goes into a claim chart that a judge, an examiner, or a licensee will actually trust?
This guide answers that question in plain language. First, you will see every component of a strong chart. Next, you will learn the main chart types, a step-by-step build process, and a sample layout. Finally, you will get the common mistakes, expert tips, and a quality checklist that you can apply to your next matter.
What is a Claim Chart?
A claim chart is a structured table that compares each element of a patent claim with the matching features of another item. That item may be an accused product, a prior art reference, a technical standard, or a competitor’s process. In short, the chart tests whether the words of a claim “read on” something in the real world.
Most charts use two or more columns. The left column holds the claim, split into individual limitations. The right column holds the evidence that shows where each limitation appears. Many teams add a third column for claim construction notes and a fourth for analysis.
Why Claim Charts Matter
Patent law turns on the claims. Under 35 U.S.C. § 271, a party infringes when it makes, uses, sells, offers to sell, or imports a patented invention without authority. For literal infringement, the accused product must meet every limitation of the claim. A claim chart tests that rule one limitation at a time.
Teams use claim charts for several jobs:
- Infringement analysis: Check whether a product meets each claim limitation.
- Invalidity analysis: Show that prior art discloses each limitation.
- Licensing outreach: Give a counterparty a concrete reason to negotiate.
- Claim construction: Compare competing readings of disputed terms.
- Risk assessment: Help a product team decide whether to redesign.
Quick Definition for Busy Readers
- Claim chart: A table that maps claim limitations to evidence.
- Limitation: One element or step of a claim, separated by punctuation or logical breaks.
- Accused instrumentality: The product, method, or system alleged to infringe.
- Evidence of use (EoU): A claim chart that supports an infringement or licensing position.
- Pinpoint citation: A reference to an exact page, paragraph, line, or code location.
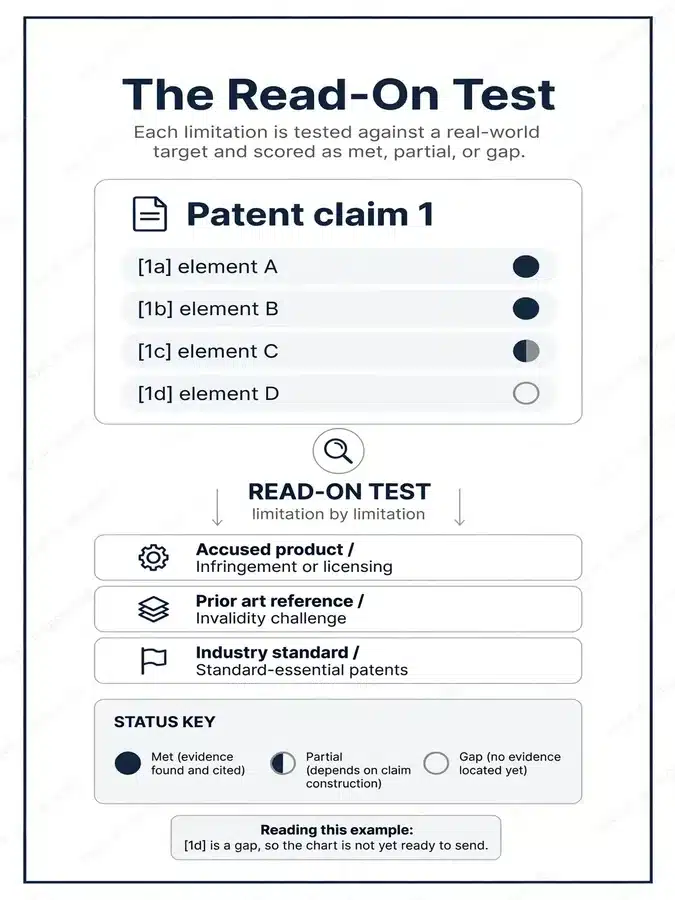
What Goes Into a Claim Chart: The Core Components
So, what goes into a claim chart that survives scrutiny? Every strong chart contains the same building blocks. Some matters need extra layers, but the core stays constant.
| Component | What it contains | Why it matters |
|---|---|---|
| Header block | Patent number, claim numbers, target product, version, date, author | Prevents confusion and supports version control |
| Claim limitations | Claim text split into labeled pieces such as [1a], [1b], [1c] | Creates the grid for element-by-element comparison |
| Evidence column | Quotes, screenshots, schematics, code excerpts with pinpoint cites | Proves each limitation exists |
| Claim construction notes | Interpretation of disputed terms, with support from the patent record | Locks the chart to a defensible reading |
| Analysis narrative | One to three sentences that explain the match | Connects evidence to claim language |
| Equivalents analysis | Function, way, and result reasoning where literal match is weak | Preserves a fallback theory |
| Assumptions and reservations | Scope limits, unknowns, and rights reserved | Protects against overstatement |
| Exhibit index | Numbered list of every source relied on | Lets a reader verify each citation |

1. The Header Block
Start with the basics. List the patent number, the claim numbers charted, the accused product or reference, and the product version. Add the chart date and the author’s initials.
This block seems minor, but it solves real problems. A chart without a version or date becomes useless after a product update. Likewise, a chart without an author trail cannot be audited later.
2. Claim Language Split Into Limitations
Next, parse the claim. Break it at semicolons, commas, and logical transitions so each limitation sits in its own row. Label each row with a consistent scheme, such as [1pre], [1a], [1b].
Here is a hypothetical claim for illustration only:
A wireless sensor comprising: a housing; a temperature element disposed in the housing; a processor configured to compare a temperature reading to a threshold; and a transmitter configured to send an alert when the reading exceeds the threshold.
That claim becomes five rows: the preamble, the housing, the temperature element, the processor, and the transmitter. Keep the claim text exactly as written. Never paraphrase the claim side of the chart.
3. The Accused Instrumentality or Reference Column
This column holds what you compare against the claim. For infringement, it describes the accused product. For invalidity, it describes the prior art reference. For licensing, it may describe a product line or a standard.
State clearly which product and which version the column covers. If several models share the same design, explain why one model represents the group.
4. Evidence With Pinpoint Citations
Evidence is the heart of the chart. Each limitation needs at least one concrete source, and the citation must lead the reader to the exact spot.
Good evidence includes:
- A quoted passage from a product manual, with page and paragraph.
- A screenshot with a date stamp and the full URL.
- A schematic or teardown photo with a figure number.
- A source code excerpt with file name and line range.
- A standards document section reference.
Weak evidence relies on a general statement like “see the website.” Judges, examiners, and licensees all ignore vague citations.
5. Claim Construction Notes
Disputed words change everything. If “configured to” or “substantially” could mean two things, your chart should state which meaning you apply and why. Cite the specification, the claims, and the prosecution history, because courts read claim terms in light of that intrinsic record.
For background on how courts approach these questions, review the guidance published by the U.S. Court of Appeals for the Federal Circuit, which hears appeals in patent cases.
6. The Analysis Narrative
Evidence alone rarely speaks for itself. A short explanation links the evidence to the claim words. Keep it factual, and avoid broad conclusions like “this obviously meets the limitation.”
A useful pattern has three parts:
- Identify the claim term.
- Point to the evidence.
- Explain why the evidence satisfies the term under your stated construction.
7. Doctrine of Equivalents Reasoning
Sometimes the product does not match a limitation word for word. In that case, a litigation chart may add an equivalents section. The usual test asks whether the accused feature performs substantially the same function, in substantially the same way, to achieve substantially the same result.
Handle this section carefully. Prosecution history estoppel can limit equivalents when the applicant narrowed a claim during examination. The Manual of Patent Examining Procedure explains how claims are examined and amended, which helps you spot those limits.
8. Assumptions and Reservations
Close the chart with a short statement. Note that the analysis rests on public information, that discovery may change conclusions, and that you reserve the right to amend. This protects credibility if later facts differ from early assumptions.
Types of Claim Charts and When to Use Each
Not every chart serves the same purpose. The right type depends on your goal and your audience. Therefore, decide the purpose before you pick a template.
| Chart type | Purpose | Left column | Right column | Typical audience | Main risk |
|---|---|---|---|---|---|
| Infringement chart (EoU) | Show a product meets each claim limitation | Asserted claim limitations | Accused product evidence | Courts, licensees, opposing counsel | Overreading marketing language |
| Invalidity chart | Show prior art discloses each limitation | Challenged claim limitations | Prior art passages | PTAB, examiners, courts | Missing a limitation |
| Claim construction chart | Compare competing meanings of terms | Disputed terms | Intrinsic and extrinsic support | Judges, special masters | Ignoring the prosecution history |
| Licensing or portfolio chart | Support outreach and negotiation | Representative claims | Products, services, standards | Business and legal negotiators | Revealing weaknesses |
| Product-to-product chart | Compare a design with a patent for clearance | Claim limitations | Internal design features | Product and legal teams | Stale product data |
Infringement Charts and Evidence of Use
An infringement chart, often called an evidence of use chart, targets one patent and one accused product. It is the most common chart in enforcement and licensing work.
Invalidity Charts
An invalidity chart flips the exercise. The left column still holds the claim, but the right column cites prior art. For inter partes review, the petition must identify the challenged claims, the grounds, the construction of key terms, and the evidence relied on, as 37 C.F.R. § 42.104 describes. The Patent Trial and Appeal Board publishes procedural resources for these proceedings.
Related reading: Teak explains the support side of these filings in What Is the Paralegal’s Role in an Inter Partes Review (IPR) Proceeding?
Claim Construction Charts
These charts line up disputed terms against the specification, claims, and file history. Courts often request them during claim construction proceedings.
Standards and Portfolio Charts
For standard-essential patents, the right column cites sections of the technical standard instead of a product. Portfolio charts group several patents and map each to the same product line.
What Goes Into a Claim Chart for Litigation
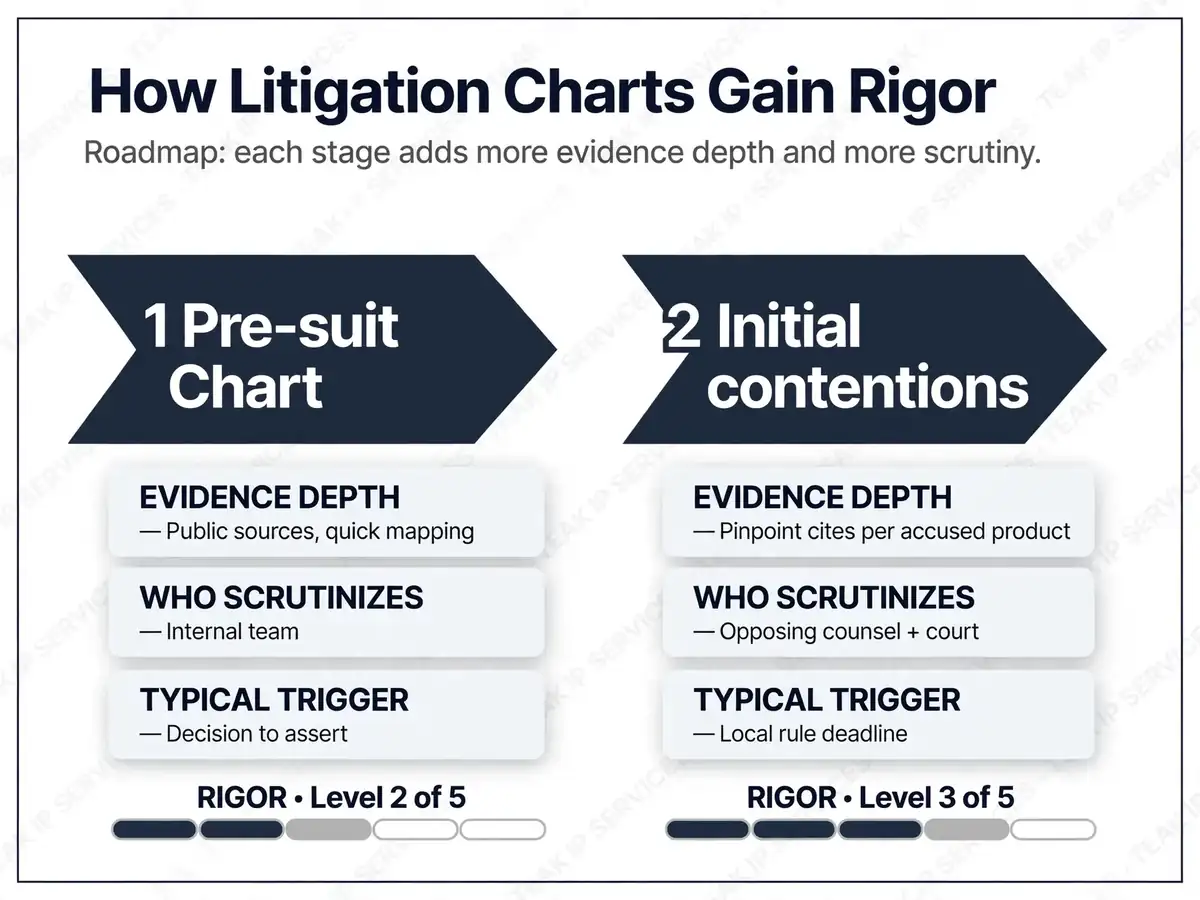
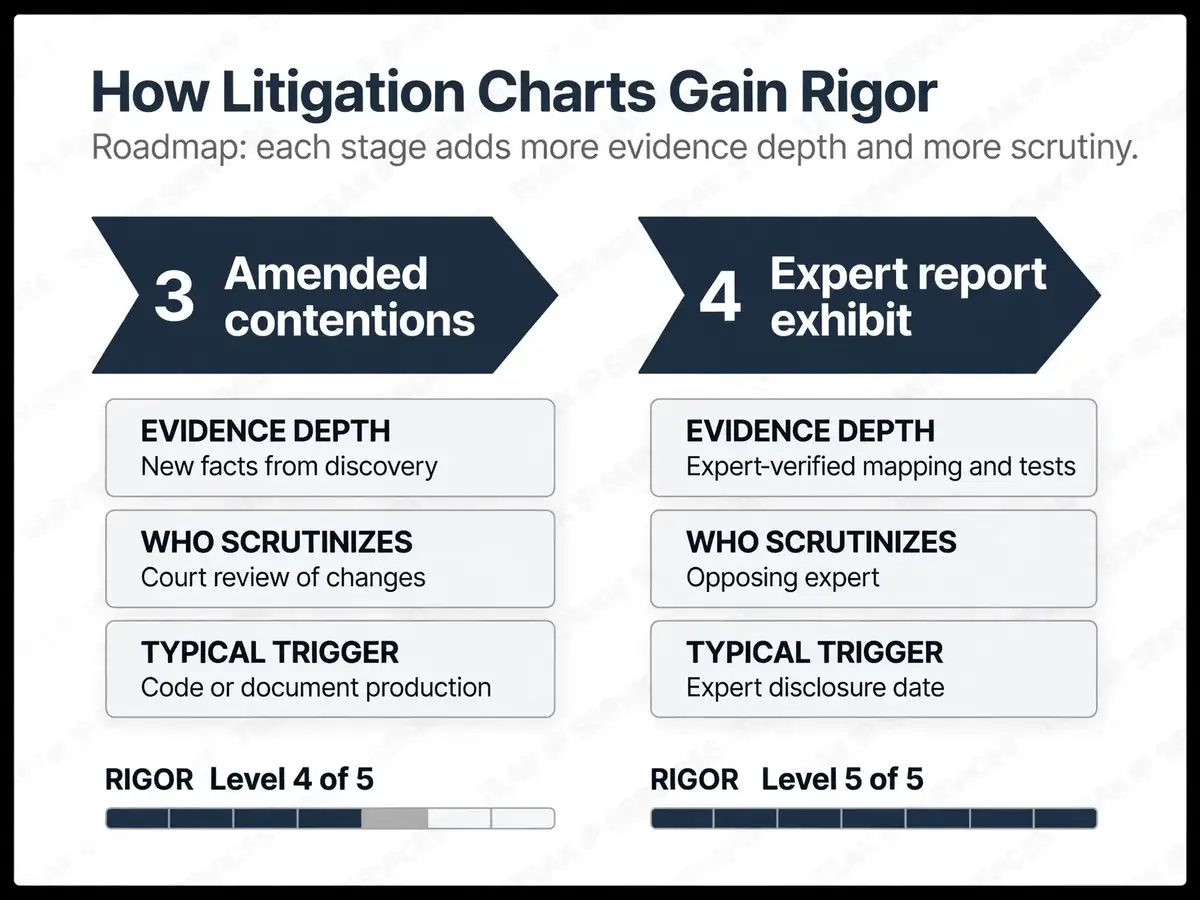
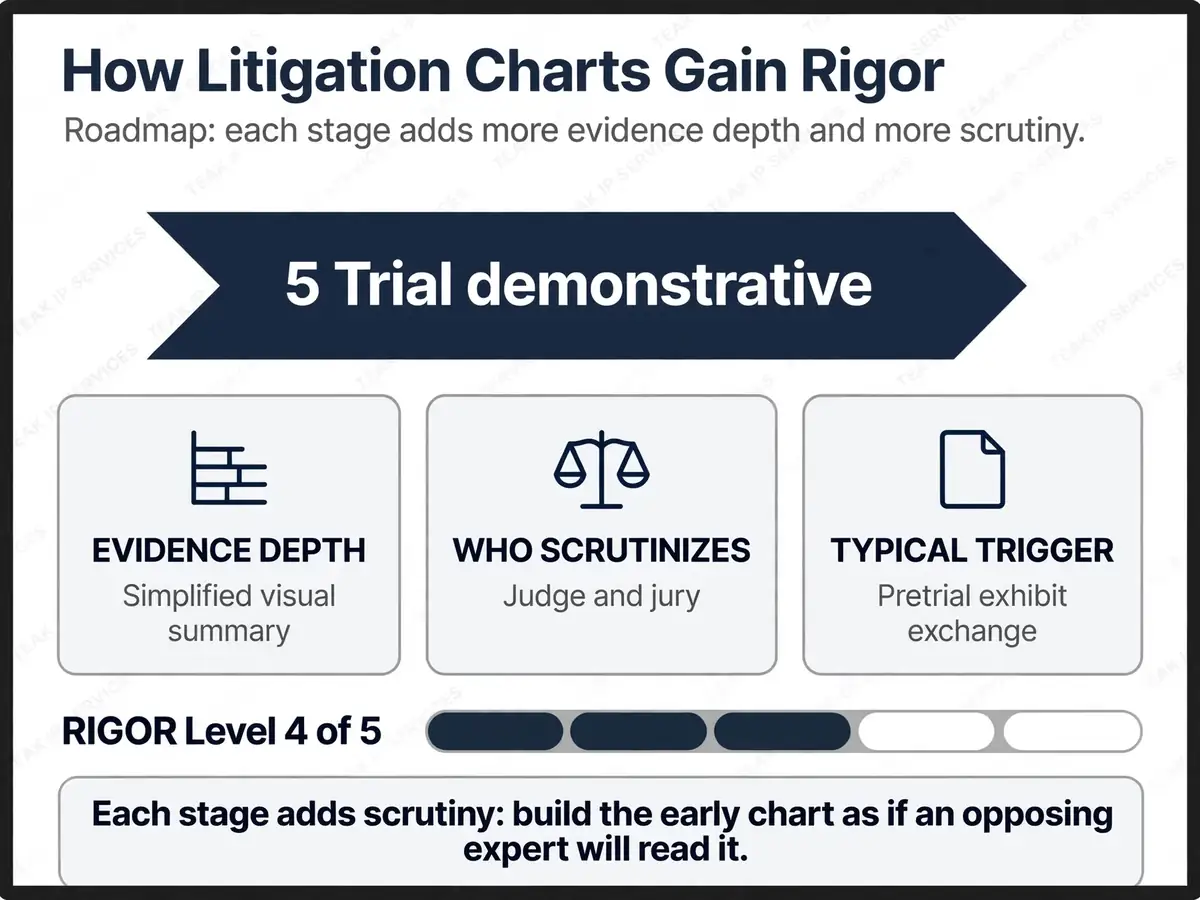
Litigation raises the bar. A chart that works in a friendly licensing call can fail under court rules. Consequently, litigation charts need extra rigor.
Follow the Local Patent Rules
Many districts require early infringement contentions. For example, the Northern District of California Patent Local Rules call for a chart that identifies where each element of each asserted claim appears in each accused instrumentality. The rules also expect separate disclosure of equivalents theories and of structures tied to means-plus-function claims.
Always read your court’s rules before you draft. Deadlines, required detail, and amendment standards vary by district.
Support Pre-Suit Investigation
Federal Rule of Civil Procedure 11 requires a reasonable inquiry before filing. A thorough pre-suit chart shows that you compared the claims to the accused product with care. The text of Rule 11 sets out the standard.
Cover Every Asserted Claim
Litigation charts usually include every asserted claim, both independent and dependent. Dependent claims need their own rows for the added limitations. They also give you fallback positions if a court narrows the independent claim.
Address Each Accused Instrumentality
If you accuse ten products, you need to chart each one or justify a representative approach. Explain why the products share the relevant feature, and cite evidence such as a common design document or shared code base.
Handle Means-Plus-Function Limitations
Some limitations recite a function without structure. Under 35 U.S.C. § 112(f), those limitations cover the structure disclosed in the specification and its equivalents. Your chart should identify the claimed function, the corresponding structure in the patent, and the matching structure in the accused product.
Prepare for Expert Work
Early charts often feed later expert reports. Therefore, write each pinpoint citation so an expert can verify it quickly. Keep every exhibit in an organized, numbered set.
Litigation Chart Essentials at a Glance
- Cite exact pages, lines, and code locations.
- Chart both literal infringement and equivalents where appropriate.
- Tie means-plus-function limitations to disclosed structure.
- Justify any representative product approach.
- Track amendments and version history.
- Preserve privilege and confidentiality markings.
What Goes Into a Claim Chart for Licensing
Licensing charts serve a different goal. You want to start a productive conversation, not to win a motion. As a result, the chart must be clear, credible, and focused.
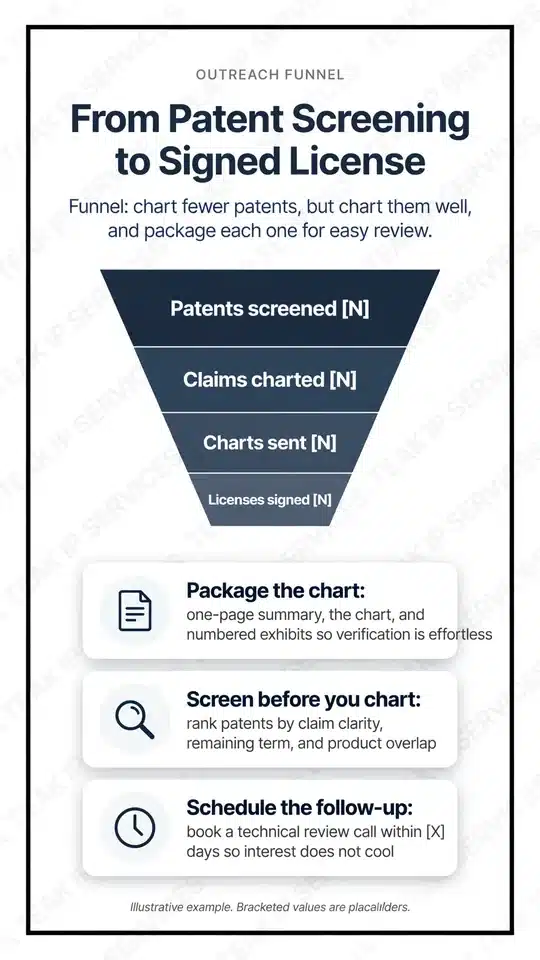
Pick the Strongest Claims
You rarely need to chart every claim. Choose a small number of claims with the clearest read on the target product. One or two strong charts often persuade better than a stack of marginal ones.
Use Public, Verifiable Evidence
Licensing charts typically rely on public sources: manuals, datasheets, developer documentation, teardown reports, and regulatory filings. Each source should be easy for the recipient to check. Archive web pages with a capture date so the evidence cannot vanish.
Keep the Narrative Tight
A licensing recipient often hands the chart to an engineer and an attorney. Short, plain explanations help both groups follow the mapping. Avoid hype, and avoid threats in the chart itself.
Mark the Communication Properly
Many licensors label negotiation materials as confidential settlement communications under Federal Rule of Evidence 408. Ask your counsel which markings fit your situation.
Consider Declaratory Judgment Risk
Sending a chart with a detailed assertion can give the recipient a basis to seek a declaratory judgment in a forum they prefer. Discuss timing and forum strategy with counsel before you send anything.
Anticipate the Counter-Chart
Expect the other side to answer with an invalidity chart. Run your own prior art check early. If you know the weak spots, you can choose stronger claims and set realistic expectations.
Build Portfolio Context
Licensing programs often involve several patents. Group charts by product line, and keep a master index. For teams building an internal licensing function, Teak’s guide to structuring a corporate IP department from scratch offers a useful organizational view.
Litigation vs. Licensing Charts
| Feature | Litigation chart | Licensing chart |
|---|---|---|
| Main goal | Satisfy court rules and prove infringement | Start and support a negotiation |
| Claims covered | All asserted claims | A few strongest claims |
| Evidence depth | Deep, with pinpoint cites and exhibits | Focused, mostly public sources |
| Tone | Formal and precise | Clear and measured |
| Equivalents | Often required as a separate theory | Optional |
| Confidentiality | Subject to protective orders | Often marked under FRE 408 |
| Revision cycle | Amended per court rules | Updated as talks evolve |
Step-by-Step: How to Build a Claim Chart
Follow this repeatable process to see what goes into a claim chart in practice. Each step builds on the last.
- Define the purpose, forum, and audience. Decide whether the chart supports a lawsuit, an IPR, a licensing letter, or an internal clearance review. The purpose sets the depth and the tone.
- Collect the patent record. Gather the issued patent, all family members, the prosecution history, and any post-grant filings. Note priority dates and assignments.
- Read the specification and file history. Learn how the inventors described the invention, and look for statements that narrow or define key terms.
- Parse the claims into limitations. Split each claim into labeled rows. Keep the original wording intact.
- Settle a claim construction approach. List terms that may be disputed. Record your proposed meaning and the record support for it.
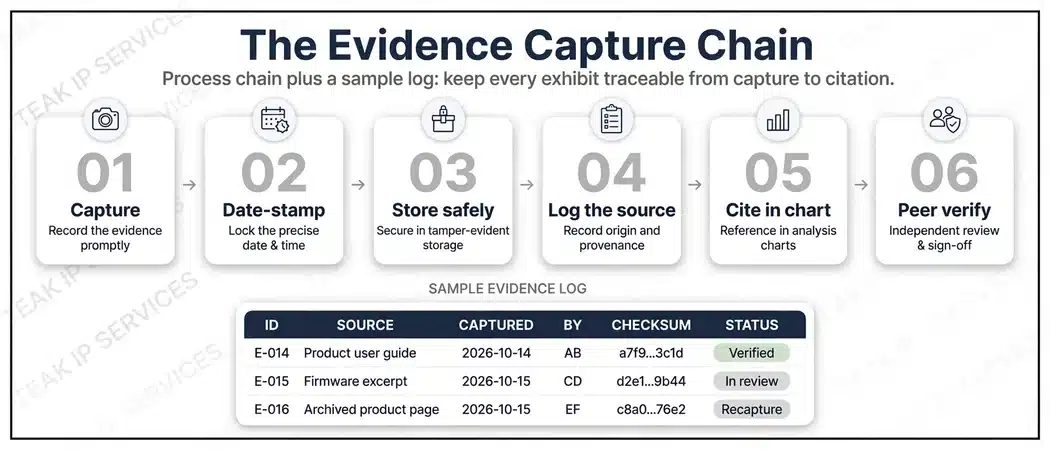
- Gather evidence on the target. Collect manuals, code, teardown results, test data, and public statements. Date-stamp and archive each item.
- Map each limitation to evidence. Place the best evidence beside each row. Add pinpoint citations as you go, not afterward.
- Write the analysis and fallback theories. Explain each match in plain sentences. Add equivalents reasoning where a literal match is uncertain.
- Review, test, and finalize. Have a second reviewer check every citation. Confirm privilege markings, add the exhibit index, and lock the version.
Quick Time and Effort Guide
| Chart scenario | Typical complexity | Main time driver |
|---|---|---|
| One claim, one public product | Low | Finding clean evidence |
| Several claims, one product | Medium | Dependent claim mapping |
| One patent, many products | High | Justifying representative products |
| Software claims with source code | High | Code review and pinpoint cites |
| Portfolio chart across a product line | Very high | Coordination and consistency |
Sample Claim Chart Layout
The table below shows an illustrative layout. The patent, product, and exhibits are fictional.
Hypothetical Patent: U.S. Patent No. X,XXX,XXX | Claim: 1 | Accused product: “TempGuard X2” | Version: 2.1 | Date: November 2026
| Claim 1 limitation | Evidence in TempGuard X2 | Source (pinpoint) | Analysis |
|---|---|---|---|
| [1pre] A wireless sensor comprising: | The datasheet describes the device as a “wireless temperature sensor.” | Ex. A, Datasheet, p. 1, para. 1 | Meets the preamble to the extent it is limiting. |
| [1a] a housing; | The teardown shows a molded plastic enclosure that holds the circuit board. | Ex. B, Teardown Report, Fig. 3 | The enclosure functions as the claimed housing. |
| [1b] a temperature element disposed in the housing; | A thermistor sits on the board inside the enclosure. | Ex. B, Fig. 5; Ex. C, Schematic, sheet 2 | The thermistor is the temperature element, and it sits inside the housing. |
| [1c] a processor configured to compare a temperature reading to a threshold; | Firmware compares the sensor reading to a user-set alarm limit. | Ex. D, Source Code, alarm.c, lines 112-140 | The comparison logic shows the processor is configured as claimed. |
| [1d] a transmitter configured to send an alert when the reading exceeds the threshold. | The radio sends an alert packet when the reading passes the alarm limit. | Ex. A, p. 4; Ex. D, radio.c, lines 60-88 | The alert transmission is triggered by the threshold condition. |
Notice three habits in this sample. First, every row has an exhibit with a pinpoint location. Second, the analysis column stays short and factual. Third, the chart uses a consistent labeling scheme that a reviewer can follow in seconds.
Evidence Sources and How Much Weight They Carry
Evidence quality varies. Consider the strength and the risk of each source before you rely on it.
| Evidence source | Typical strength | Watch out for |
|---|---|---|
| Source code | Very strong for software claims | Access limits before discovery |
| Teardown or reverse engineering | Strong for hardware claims | Chain of custody and lawful acquisition |
| Product manuals and datasheets | Strong for features and specs | Version mismatches |
| Technical standards | Strong for standard-essential patents | Optional vs. mandatory sections |
| Test results | Strong when the method is documented | Reproducibility and expert support |
| Marketing material | Moderate to weak | Puffery that does not reflect actual design |
| Third-party reviews | Weak to moderate | Hearsay and inaccuracy |
| Regulatory filings | Strong for regulated products | Redacted content |
A good chart often combines several source types for the same limitation. For example, a datasheet claim backed by a teardown photo carries more weight than either alone.
Common Claim Chart Mistakes
Even experienced teams slip. Watch for these frequent errors.
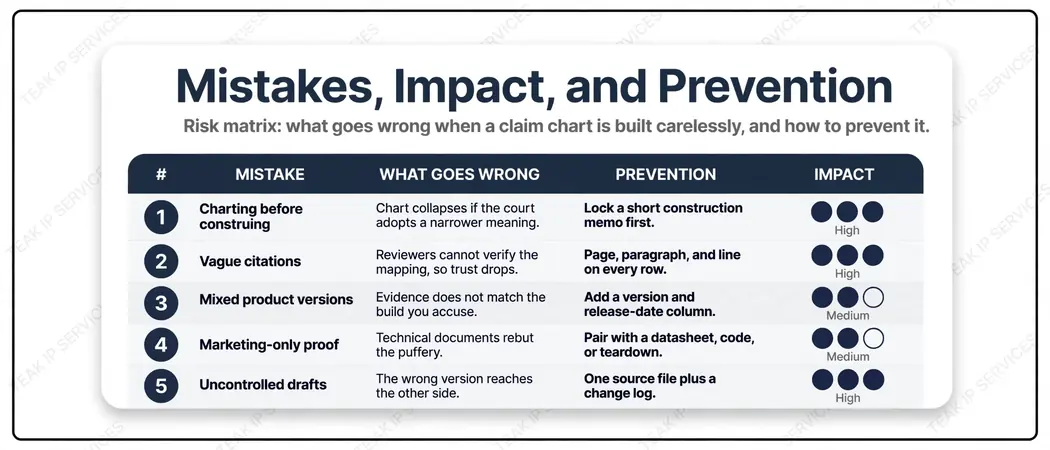
- Charting before construing key terms. If you map evidence to an undefined term, the chart can collapse when the court adopts a different meaning.
- Using conclusory analysis. A line like “the product meets this limitation” proves nothing. Explain why.
- Skipping pinpoint citations. Vague references force readers to hunt, and they erode trust.
- Mixing product versions. Evidence from version 1.0 cannot support a claim about version 3.0.
- Relying on marketing copy alone. Promotional language rarely proves how a product actually works.
- Ignoring dependent claims. Without them, you lose valuable fallback positions.
- Overlooking means-plus-function structure. Courts require the corresponding structure, so omit it at your own risk.
- Forgetting prosecution history estoppel. Equivalents arguments can fail when the applicant narrowed the claim during examination.
- Letting web evidence disappear. Pages change or vanish. Archive each capture with a date.
- Poor version control. Teams that email five drafts of the same chart eventually send the wrong one.
Expert Tips for a Stronger Chart
These tips come from workflows that tend to hold up under pressure.
- Write the chart for a skeptical reader. Imagine a judge who has never seen the product. Every row should make sense without outside explanation.
- Separate fact from argument. Put raw evidence in one column and your interpretation in another. Readers can then test your reasoning.
- Use a consistent labeling system. Labels like [1a] and [2c] make cross-references simple.
- Quote sparingly, cite precisely. Short quotes with exact locations beat long pasted blocks.
- Date-stamp everything. Record when you captured each web page, document, or screenshot.
- Adopt a two-reviewer rule. One person drafts, and a second person checks every citation against its source.
- Track unknowns openly. If a limitation lacks evidence, say so internally. Then decide whether to seek more facts, drop the claim, or pick a stronger one.
- Verify AI-assisted output. Drafting tools can speed up first-pass searching and formatting. However, you must check every quote and citation against the original source, because a fabricated reference can damage credibility fast.
- Protect confidentiality. Charts often contain privileged analysis and sensitive technical data. Store them in secure systems with controlled access.
Claim Chart Quality Checklist
Use this list before any chart leaves your desk.
Content
- The header block lists the patent, claims, product, version, and date.
- The claim text matches the patent exactly.
- Every limitation has its own labeled row.
- Each row has at least one pinpoint citation.
- Disputed terms include a stated construction and support.
Reasoning
- The analysis explains each match in plain language.
- Equivalents theories appear where literal matches are weak.
- Means-plus-function limitations identify corresponding structure.
- Assumptions and reservations appear at the end.
Process
- A second reviewer verified every citation.
- Web evidence is archived and date-stamped.
- The exhibit index is complete.
- Privilege and confidentiality markings are correct.
- The final version is locked and logged.
Where Paralegal and IP Operations Support Fits
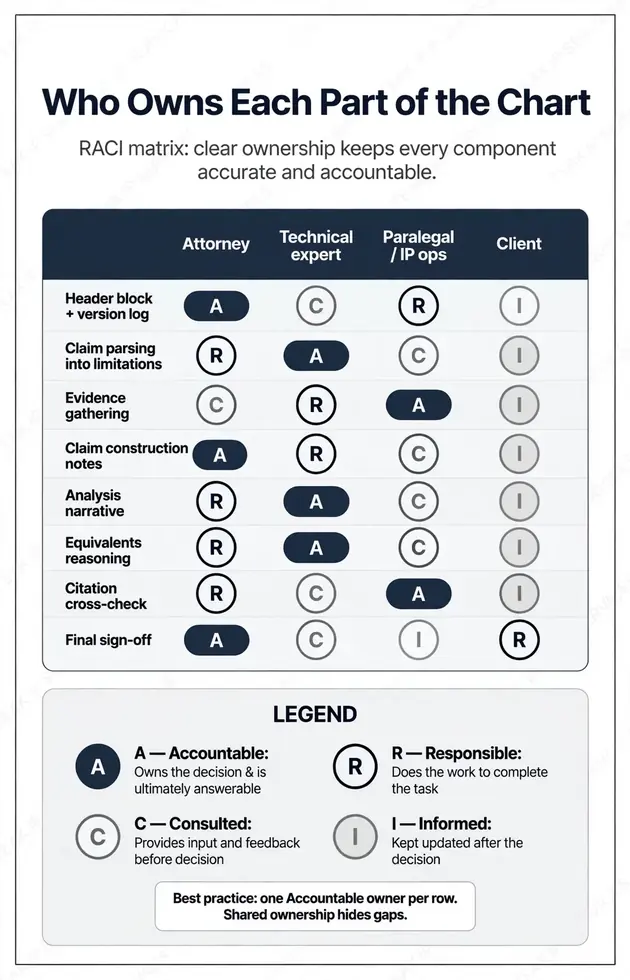
Attorneys and technical experts make the substantive calls in a claim chart. Even so, the work around the chart consumes real time. Someone must gather the file history, organize exhibits, verify citations, track deadlines, and keep documents consistent.
That is where experienced IP operations support helps. Teak’s paralegal support services and patent search services cover many of the supporting tasks that feed this kind of work, always under attorney direction. For prior art gathering, a structured search also supplies the references that invalidity charts rely on.
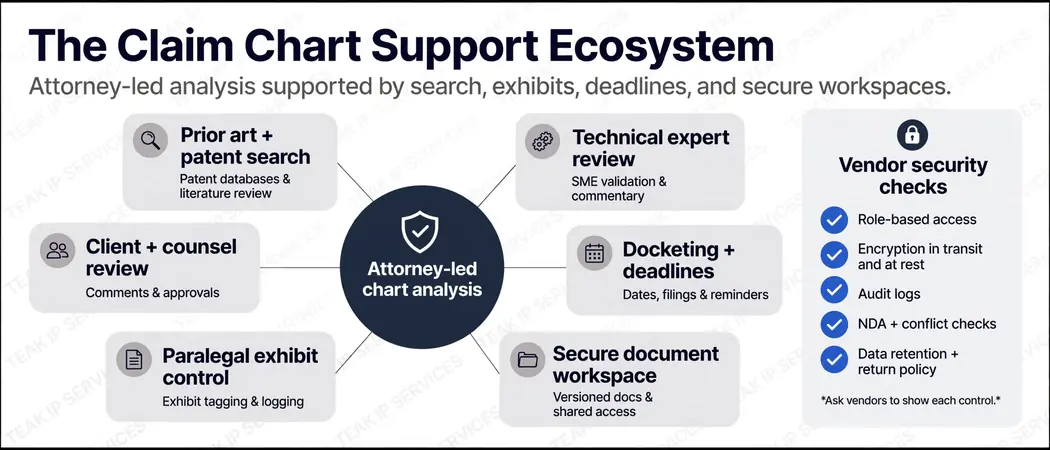
Deadlines matter just as much as content. Contention deadlines, IPR filing windows, and response dates all need reliable tracking. If your team is weighing outside help, these Teak resources offer useful context:
- Best Patent Docketing Companies for Corporate IP Departments
- What Are the Best Patent Docketing Services for Small Firms?
Protect Sensitive Case Material
Claim charts contain some of the most sensitive information in a matter. Before you share them with any vendor, confirm the vendor’s security and compliance practices. Teak covers this topic in two helpful guides: Why SOC 2 Compliance Matters When Choosing an IP Services Vendor and the IP Vendor Due Diligence Checklist for Law Firms and Corporate Legal Teams. In addition, Are Remote Patent Paralegal Services Compliant With USPTO Rules? explains what to verify about remote support.
Know Your Claim Family
Charts often target a specific claim set that came out of a long prosecution. Understanding how continuations and continued examination shape that claim set helps you pick the right claims. Teak’s article on the difference between an RCE and a continuation application provides helpful background.
For international portfolios, the World Intellectual Property Organization offers official resources on patents and the PCT system. Remember that claim scope and infringement standards differ by country, so a U.S. chart does not automatically work abroad.
FAQ
What goes into a claim chart?
A claim chart contains the patent claim split into numbered limitations, matching evidence for each limitation, pinpoint citations, claim construction notes, a short analysis, and a statement of assumptions. It usually opens with a header block that lists the patent, product, version, and date. It closes with an exhibit index.
How long should a claim chart be?
Length depends on the number of claims, the number of accused products, and the complexity of the technology. A single-claim chart for a simple product may run two or three pages. A litigation chart covering many claims and products can run hundreds of pages. Focus on clarity and verifiable evidence rather than page count.
Who prepares a claim chart?
Patent attorneys and technical experts usually lead the substantive analysis. Paralegals and IP operations specialists often support the process by organizing exhibits, verifying citations, and managing deadlines. A qualified attorney should review and approve the final chart.
What is the difference between a claim chart and an evidence of use chart?
The terms overlap heavily. An evidence of use chart is a claim chart built to show that a specific product practices a patent, and people use it often in licensing and enforcement. “Claim chart” is the broader label, and it also covers invalidity and claim construction charts.
Can I send a claim chart before filing a lawsuit?
Yes, many patent owners send charts during licensing outreach. However, a detailed assertion can create declaratory judgment risk and may shape where a dispute gets filed. Talk with a patent attorney about timing, forum strategy, and proper confidentiality markings first.
Do I need to chart every claim in a patent?
No. Licensing charts usually cover a few strong claims. Litigation charts must cover every asserted claim under the local rules and the court’s scheduling order. Dependent claims help as fallback positions, so many teams include them.
Is a claim chart enough to prove infringement?
No. A claim chart organizes your theory and your evidence, but it is not itself proof. A court needs admissible evidence, and in many cases expert testimony, to establish infringement.
How is a claim chart different from a claim construction chart?
An infringement or invalidity chart compares a claim with an outside item. A claim construction chart compares competing interpretations of the claim terms themselves, with support from the patent record.
Conclusion
So, what goes into a claim chart that earns trust in court or at the negotiating table? The answer comes down to disciplined structure. You split the claim into clean limitations, tie each one to dated and verifiable evidence, state your claim construction, and explain every match in plain language. You also note your assumptions, track your exhibits, and keep strict version control.
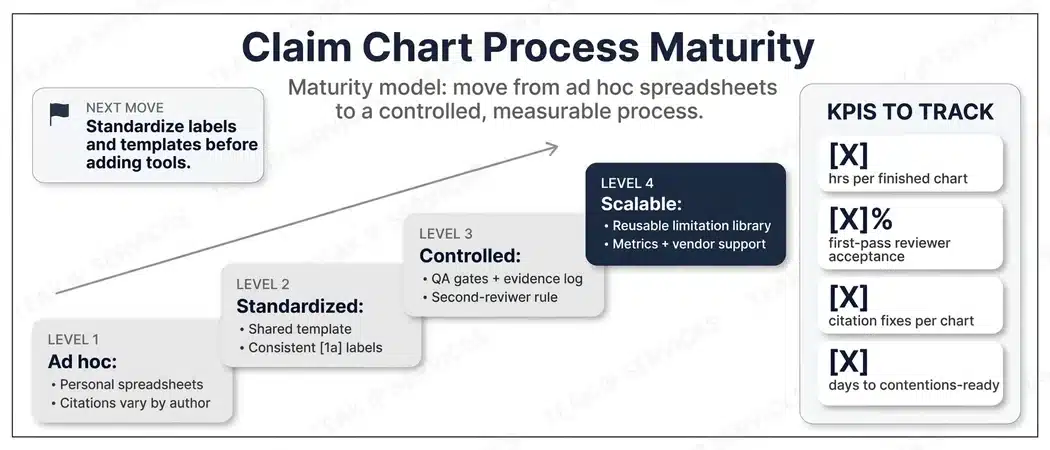
Litigation and licensing share that foundation, yet each demands a different emphasis. Litigation charts need court-rule compliance, full claim coverage, and deep pinpoint citations. Licensing charts need clarity, focus, and credible public evidence. In both cases, a second reviewer and a clear process protect you from the mistakes that undo otherwise strong cases.
If your team needs reliable support around claim chart preparation, from search and exhibit organization to docketing and paralegal assistance, Teak IP Services can help. Contact the Teak team to discuss your next matter, or browse more guides on the Teak IP blog.
Need Reliable Support for Your IP Matters?
Get dependable IP support, from patent research and paralegal assistance to docketing and portfolio management. Let Teak IP Services support your next project.

